
Eleven millimetres on a fifty-metre building
Before a plan sheet can be checked against a model, the sheet has to be placed on it. A first result for that, and the benchmark that keeps our derived room topology honest.
Most of what we sell is a comparison: the plan against the model, the plan against the rule, this issue against the last. Every comparison has a prerequisite that gets skipped in conversation: the two sides have to be in the same place. A PDF sheet knows nothing about where it sits in the building’s coordinates. Until it does, you cannot cut the toilet room out of the second-floor plan and know which coordinates the crop covers.
The fit
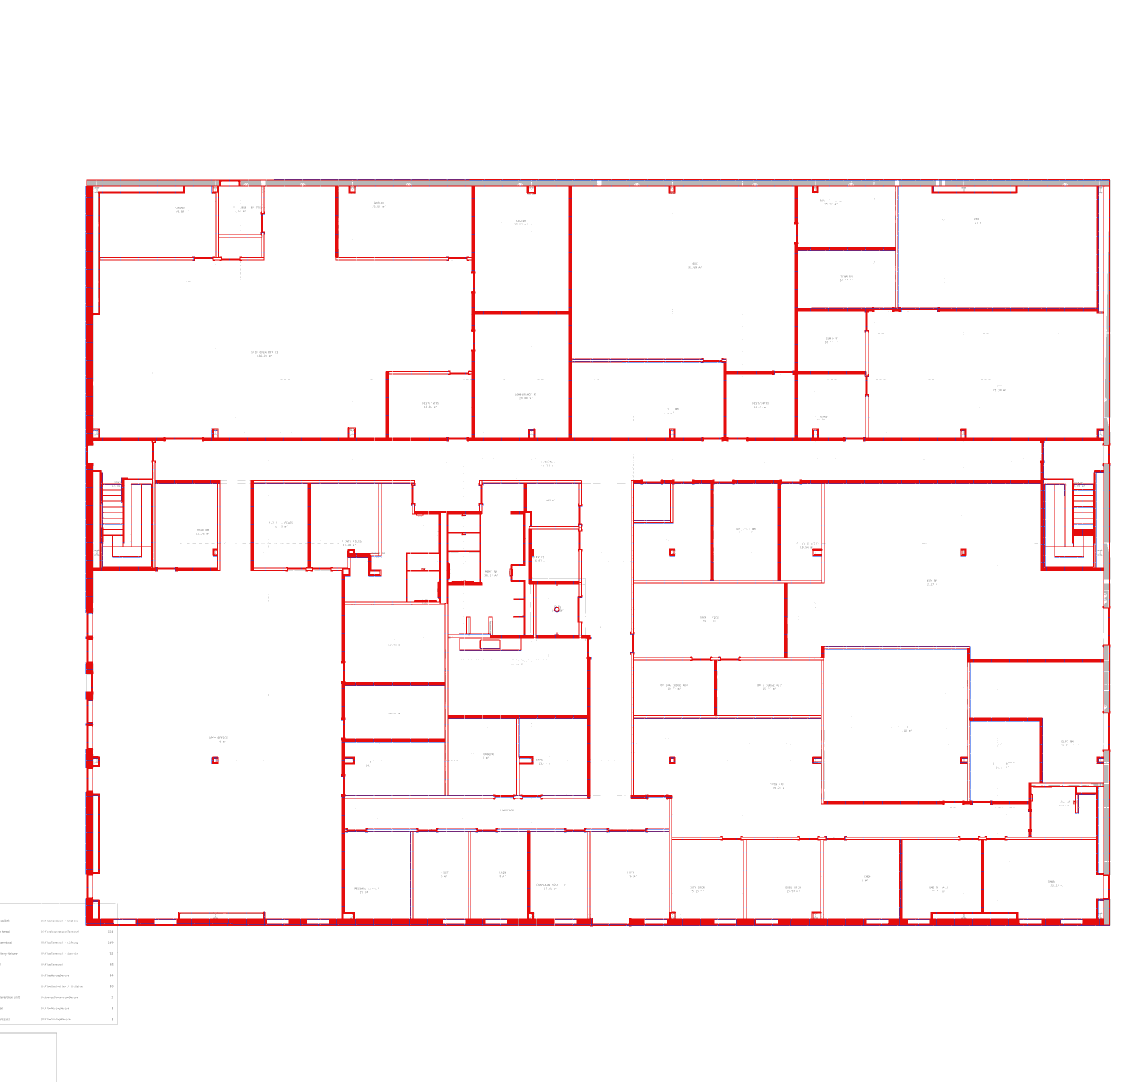
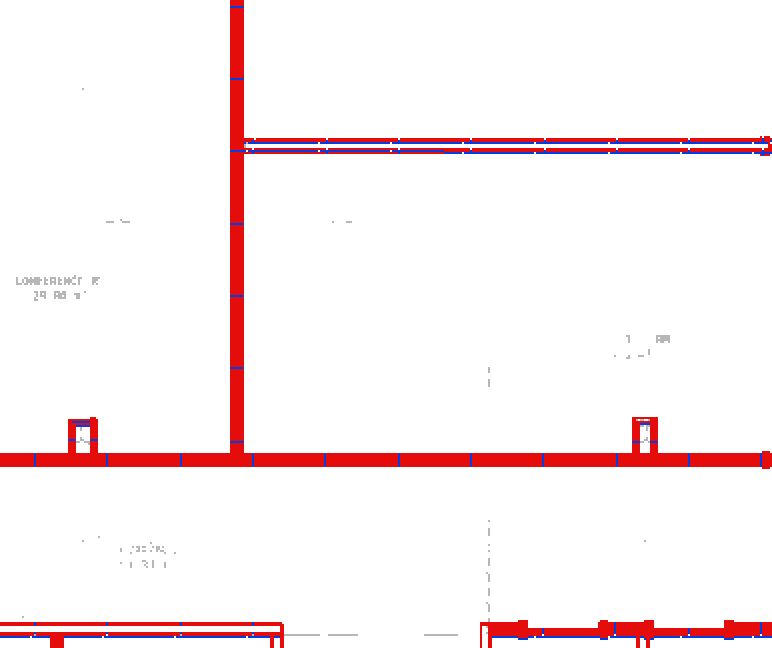
The first result is deliberately narrow. One building, one storey, drawn twice by independent toolchains from the same model: a plain storey plan on one side, our own issued A1 sheet on the other, with every trade on it, ducts, pipes and cable trays over the architecture. Both are reduced to ink. The page furniture is cut away, title column, frame, zone markers, dimension chains, none of which exists on the other side. Then four numbers are fitted: scale, rotation and two offsets, by minimising the distance between the two sets of wall lines, coarse to fine.
Because both exporters record their own transform, the answer is known, and the fit can be graded in millimetres rather than admired in an overlay. Corner error: eleven millimetres on a footprint of fifty by thirty-seven metres. Scale recovered to two hundredths of a percent. The 117 room crops that follow from it overlap the true rooms at 0.994. Forty seconds on one processor core.
What the placement buys, on a building you can click through
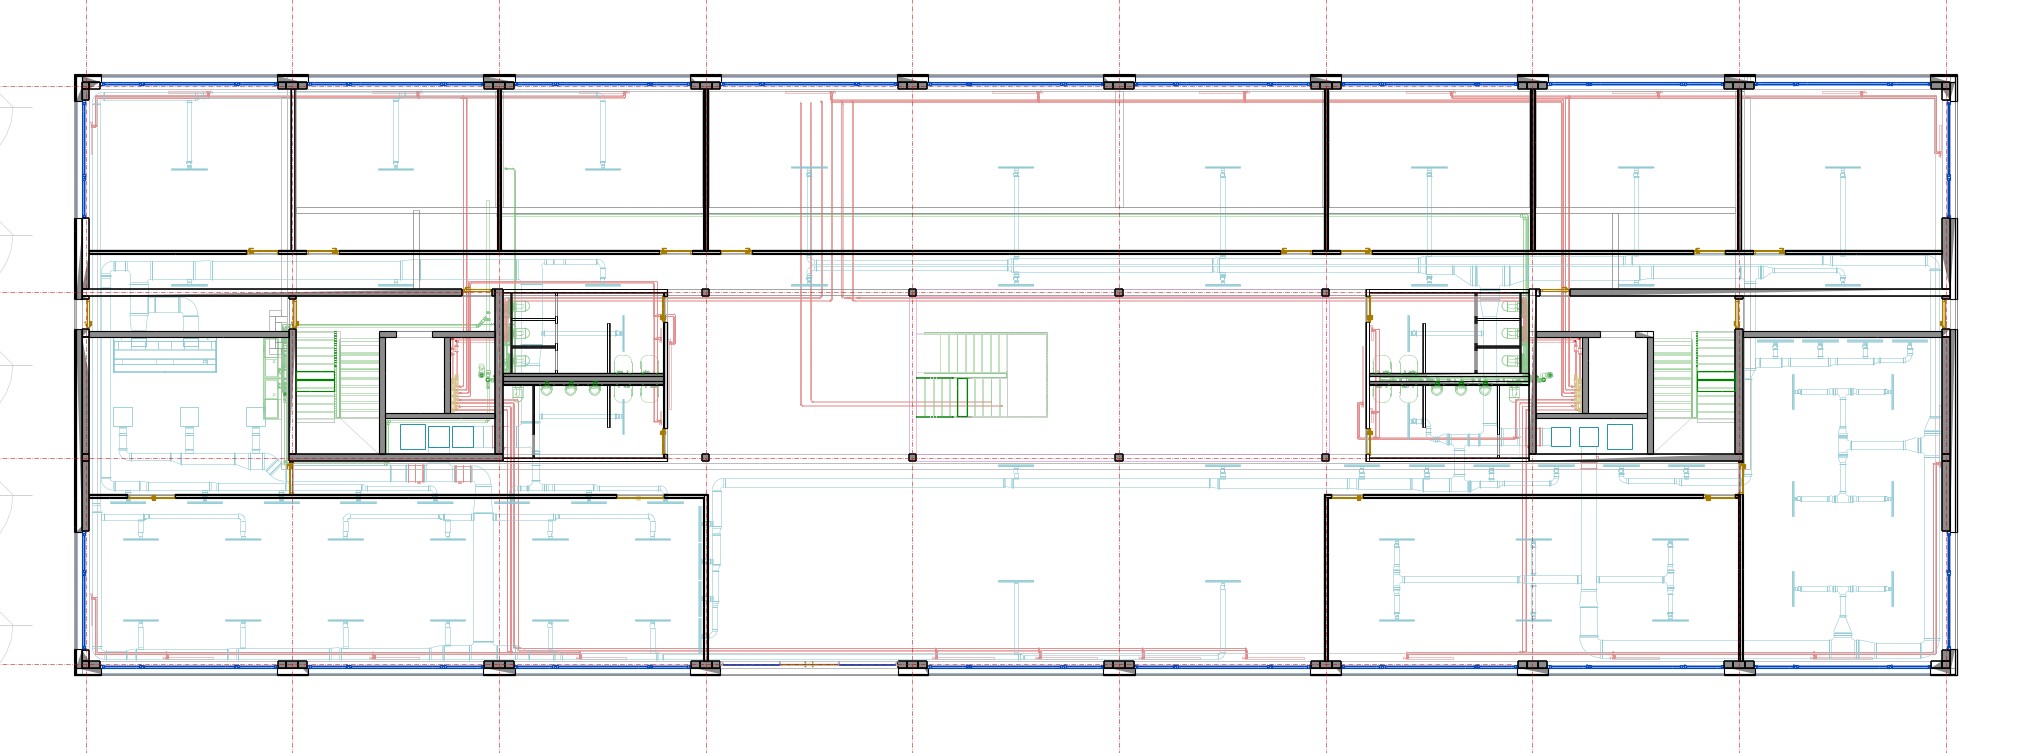
The number is abstract until you see what it is for. Below are the three storeys of a public office building, issued as sheets by our own exporter. Every room is a node in the graph derived from the model’s geometry. Click one. The card shows what hangs on that node: its area, its doors, the rooms it connects to, the components the model places inside it, and the crop of the sheet at the position the transform names for it. That crop is the answer to “how many air terminals are in this room” in the form we want to give it: a picture of the thing being counted, attached to the thing it belongs to.
Gruppenbüro 1
- Area
- 36.9 m²
- Doors
- 1
- Sheet
- A-101
- Identifier
- 3DCde23Rb8uBrhrJgjcLQB
- 2 space heaters
- 1 air terminals
The crop on the left is the picture that hangs on the node: cut from the sheet where the transform says this room is.
The trap that looks like success
One detail of the method is worth telling, because it is the kind of thing that only surfaces when you score against truth. The natural way to fit a sparse drawing into a dense one is to ask, for each line in the drawing, how far the nearest ink is. That measure has a perfect solution: shrink the drawing onto any dense patch of pipework. Every line then sits on ink and the cost is zero. The fit looks superb and is meaningless. The distance has to be charged in both directions, so that sheet ink left unexplained costs as much as drawing lines left unplaced. There is a test in the code that asserts exactly this. And the row of our results table without the page crop, corner error twenty metres, is what happens when the furniture stays in.
What the result does not prove is also stated. It registers an export to an export; both sides are renders of the same . A customer’s PDF was drawn by a person, in their office’s conventions, and the next step is to find out how far the same method carries there. The estimator therefore reports its own confidence: low when the fit is loose, when little of the drawing found a line to sit on, or when a second, unrelated pose fitted nearly as well. A confidently wrong alignment is, from the inside, a confident fit.
The graph underneath has its own benchmark
The crop hangs on a room. The room comes from a graph we derive from the model’s geometry: which rooms exist, which walls bound them, which doors connect which pair. Some files state that topology themselves, and those files are an answer key. The comparison is exact: both sides key on the element’s global identifier, no tolerance, no judge, no model.
Across 25 public building models and 1,813 doors that could be scored, 94.1 percent are assigned to the same pair of rooms the file states. Room-to-wall bounds score 100 percent precision and 78 percent recall over about four thousand edges: every wall we name really bounds the room, and what we miss is walls the file also lists. Five models score 100 percent.
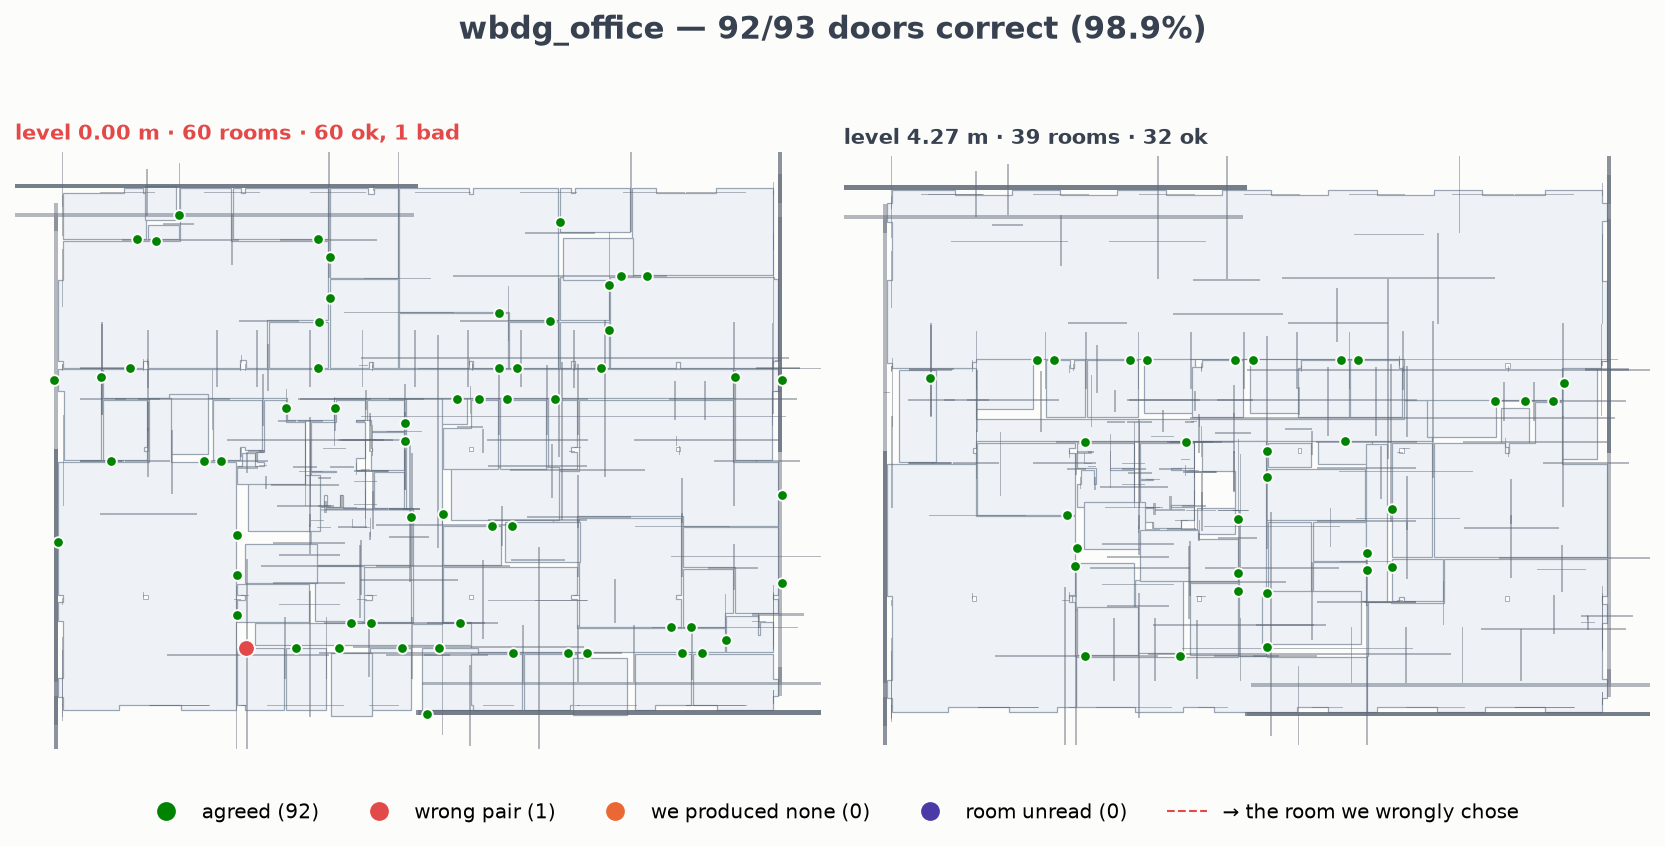
Two rules make that number worth something. First, a door touching a room we never read is not scored as wrong. It is set aside and counted. Scoring it would measure the footprint reader, not the topology, and one model swings from 54 to 100 percent on that distinction alone. Second, every disagreement is re-decided from the geometry, independently of both sides. On one model, eight of nine remaining disagreements turn out to be cases where the file records a door against one room while a second room demonstrably abuts it. Our measured accuracy there is a floor. Tuning a derivation to agree with another tool’s output, without checking, is how you end up fitting someone else’s bugs.
Why this matters to a buyer
Because every answer we give about a building hangs on this chain: sheet placed on model, room cut from sheet, room known from geometry, finding attached to the room with its picture. Each link has a number, and each number has a control. Whatever a later note here claims about reading plans stands on a registration measured in millimetres and a topology measured against the files that state their own.
Registration pilot: 26 August 2026, six configurations of one storey, 2,400 px working resolution. Topology benchmark: 25 model-subjects, results as of August 2026. Building models are public test models; no customer data was used.
More from the blog